 You might notice a spike the evening of the fourth. I realized after some thought that I had bottled the latest IPA that evening and had to move my fermenter to get to the carboy. I can only assume that the spike in gas production was caused by agitating the brew as I slid the barrel along the floor. Otherwise a rather nice curve with a bit of a left shift. Time to get back to building the pages to help archive the brews.
Wednesday, June 6, 2007
Data!
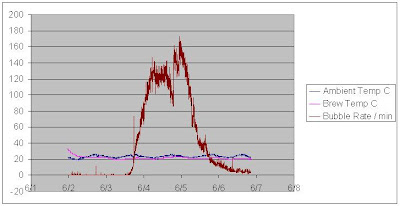
After several attempts a getting some good contiguous data I have succeeded in logging a fermentation...er sort of. The graph below shows the bubble rates (the number of bubbles through the bubble lock divided by minutes), the ambient temperature (few inches above the board) and the temperature of the outside of the barrel. Ok so the temperatures aren't all that exciting, the one exception is the temp of the brew bucket coming down as the wort cooled at the very beginning. The cool part are the rates of gas production that give a clear idea of when things are really cooking.
 You might notice a spike the evening of the fourth. I realized after some thought that I had bottled the latest IPA that evening and had to move my fermenter to get to the carboy. I can only assume that the spike in gas production was caused by agitating the brew as I slid the barrel along the floor. Otherwise a rather nice curve with a bit of a left shift. Time to get back to building the pages to help archive the brews.
 You might notice a spike the evening of the fourth. I realized after some thought that I had bottled the latest IPA that evening and had to move my fermenter to get to the carboy. I can only assume that the spike in gas production was caused by agitating the brew as I slid the barrel along the floor. Otherwise a rather nice curve with a bit of a left shift. Time to get back to building the pages to help archive the brews.
Subscribe to:
Post Comments (Atom)
1 comment:
Nice work. I still expected more of a difference between the ambient and fermentation temps? What gives? Still the drafty kitchen?
Anyway, nice set-up and I find it interesting that you can view it remotely.
Looking forward to the stout!
--Your neighbor Jeremy :)
Post a Comment